aaalm
aaalm is a zeek package that passively infers the structure of an IPv4 network over Ethernet from communication among hosts.
It will discover gateways, routers, and associate devices to subnets and gateways based on hueristics from analysis of raw packets and connections. It can even infer routing paths if the analyzed traffic contains icmp responses to a traceroute.
The tool inside of /viz can then interpret this information to generate a diagram suitable for printing on A4 paper or even bigger on A3, hence the name, the A3 Lan Mapper.
Here are some examples.
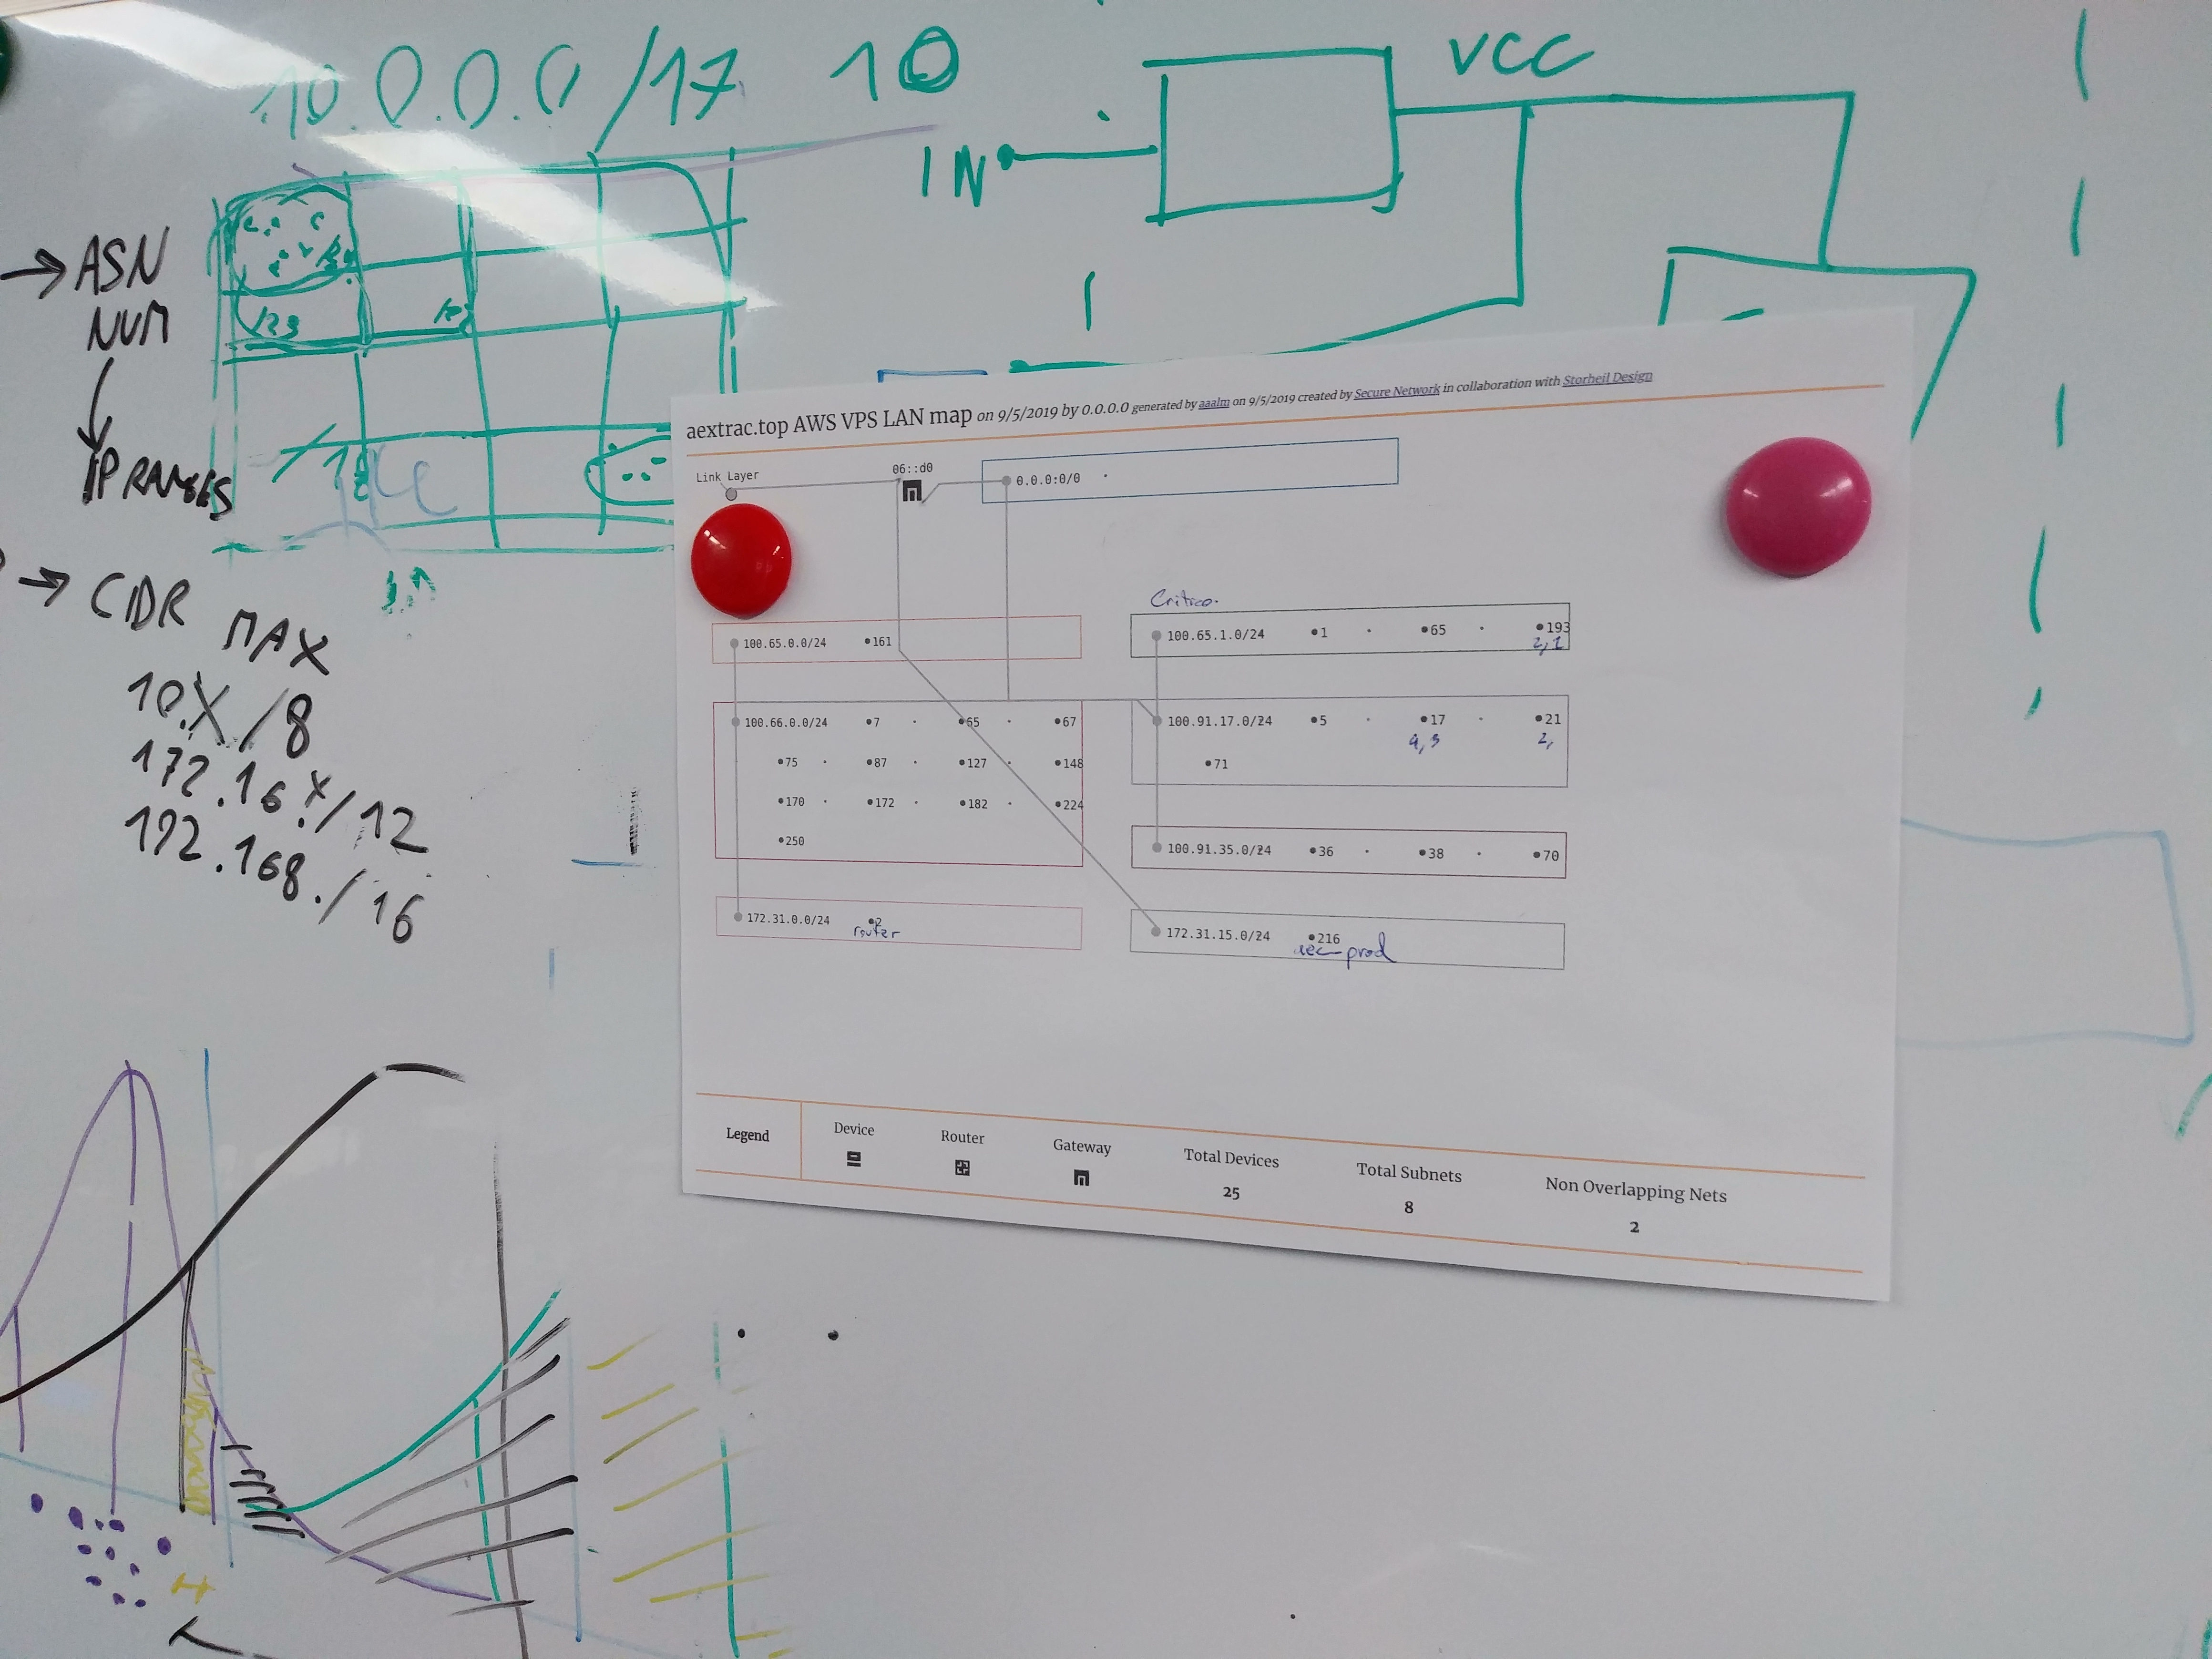
What a VPS on Amazon can see by running traceroute.
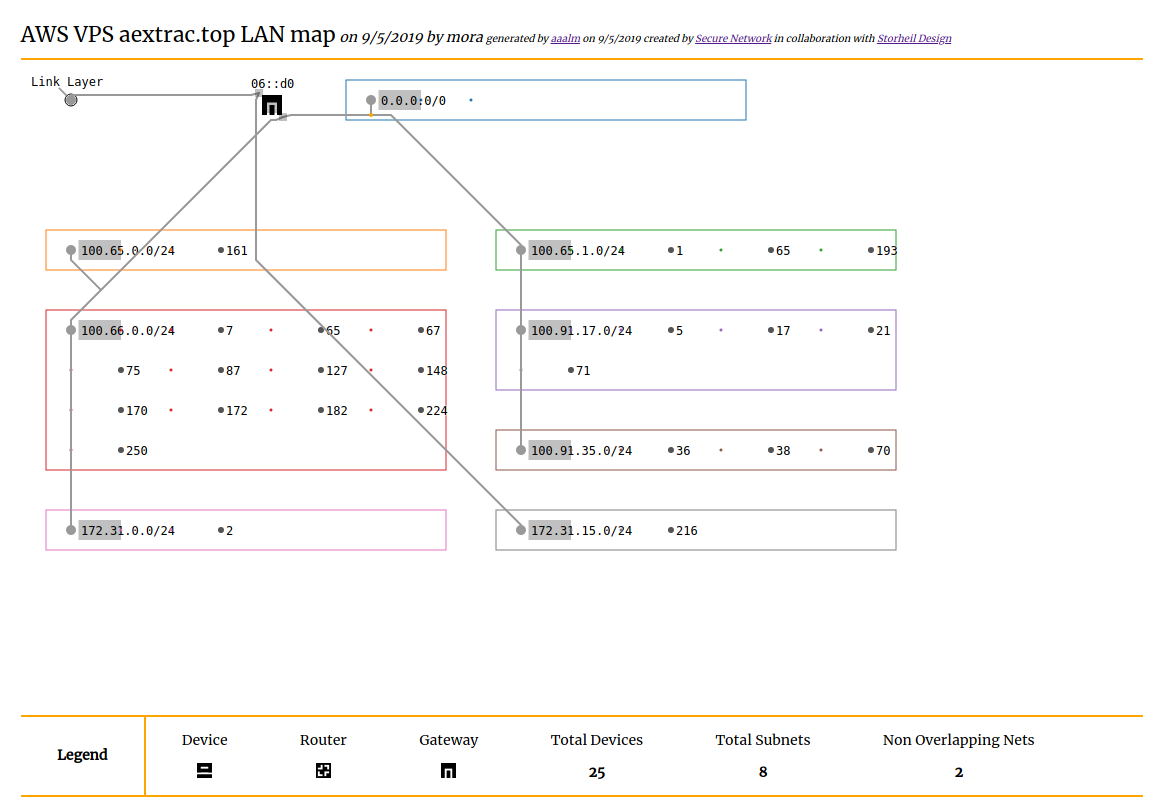
The same diagram in A4
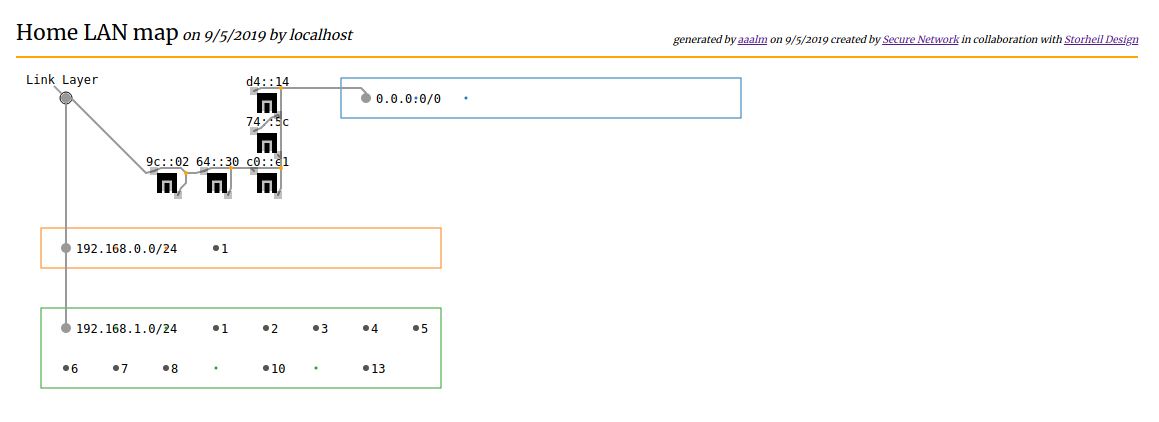
The network at my apartment
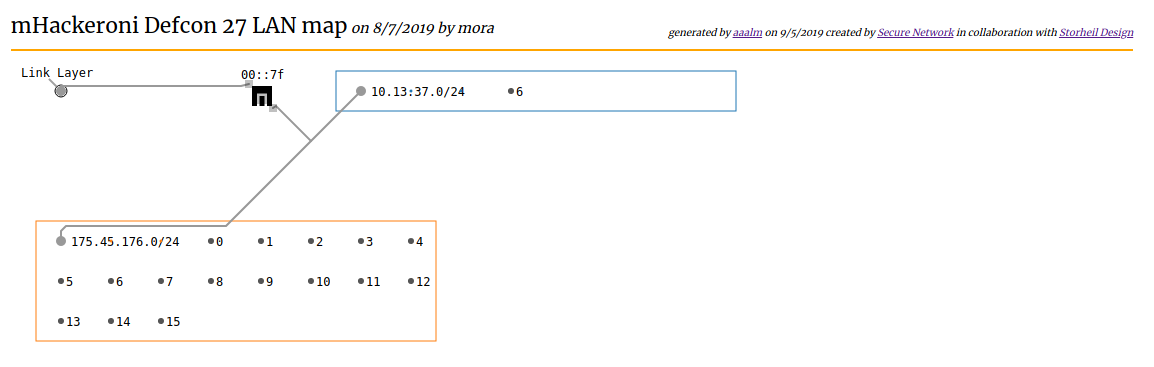
During CTFs teams must attack and defend network services. This is what the network at DEFCON 27 looked like to mHACKeroni:
Installation
Install Zeek and its package manager zkg.
Use the zkg to download and install the package.
> zkg install aaalm
Otherwise clone this repository.
Usage
Run zeek with the following command with a packet capture file with lots of inter device communication.
> zeek -r path/to/file.pcap -b main.zeek
Editing Verbose flag will output a set of subnets that can be used as a starting point to define the Sites::local_nets set.
> zeek -r path/to/file.pcap -b main.zeek -e "redef EtherIPv4::Verbose = T;"
The devices.log file will contain the inferred network structure, while subnet.log will contain the identifed local networks.
Generating the graphics
Visit my site to try it out.
The DIY version requires that you can run a webserver locally. With python3 it's easy:
> python -m http.server -b localhost
Now navigate to the index with your browser and follow the instructions to generate a map.
Notes
Performance
Note that this package uses the raw_packet event to analyze every packet contained in a pcap or observed on the monitored interface.
If you are using a cluster to monitor gigabit loads do not use this package in realtime.
Execution against hundreds of megabytes of traffic produces meaningful output in less than thirty seconds.
If you are monitoring traffic in tens or hundreds of gigabits per second but do not already know your network's layout, you may have other problems.
Visualizing routing paths
If your packet capture file contains traffic from programs like traceroute, it's possible to visualize these paths.
Note that only traceroutes performed with low TTL UDP packets which solicit ICMP responses from servers are tracked.
Further there is some bug with the signature detect-low-ttls.sig that breaks detection even with some UDP traffic.
In any case the reconstructed route will be logged to the file tracedroute.log.
Techniques Used
Placing devices in subnets
By default the script uses a greedly algorithm to place addresses into \24.
For more precise subnet grouping, the script in analysis/find_subnet.py will compute a series of statistical tests to determine probable subnet groupings. The script will modify *.log the files to improve the quality of subnet groupings if the default behavoir is insufficient.
> python2 subnet_finder.py in-device.log
# Will output device.log and subnet.log
Afterwards the net_routes.log must also be updated by hand to reflect these new changes.
Identifying routers
Router identification works by tracking unique MACs inside of the l2_header and storing the set of ip_src addresses, then simply checking if these MACs are originating traffic with multiple source IP addresses.
Identifying gateways
Gateway identification works similiarly but captures the special case where emitted traffic seems to originate from a public IP address.